
Launch Trajectory Visualizer
Building a 3D visualization system that lets engineers simulate hypersonic projectile paths at 10,000+ mph — turning abstract physics into something you can see and interact with.
Engineers couldn't see what they were building
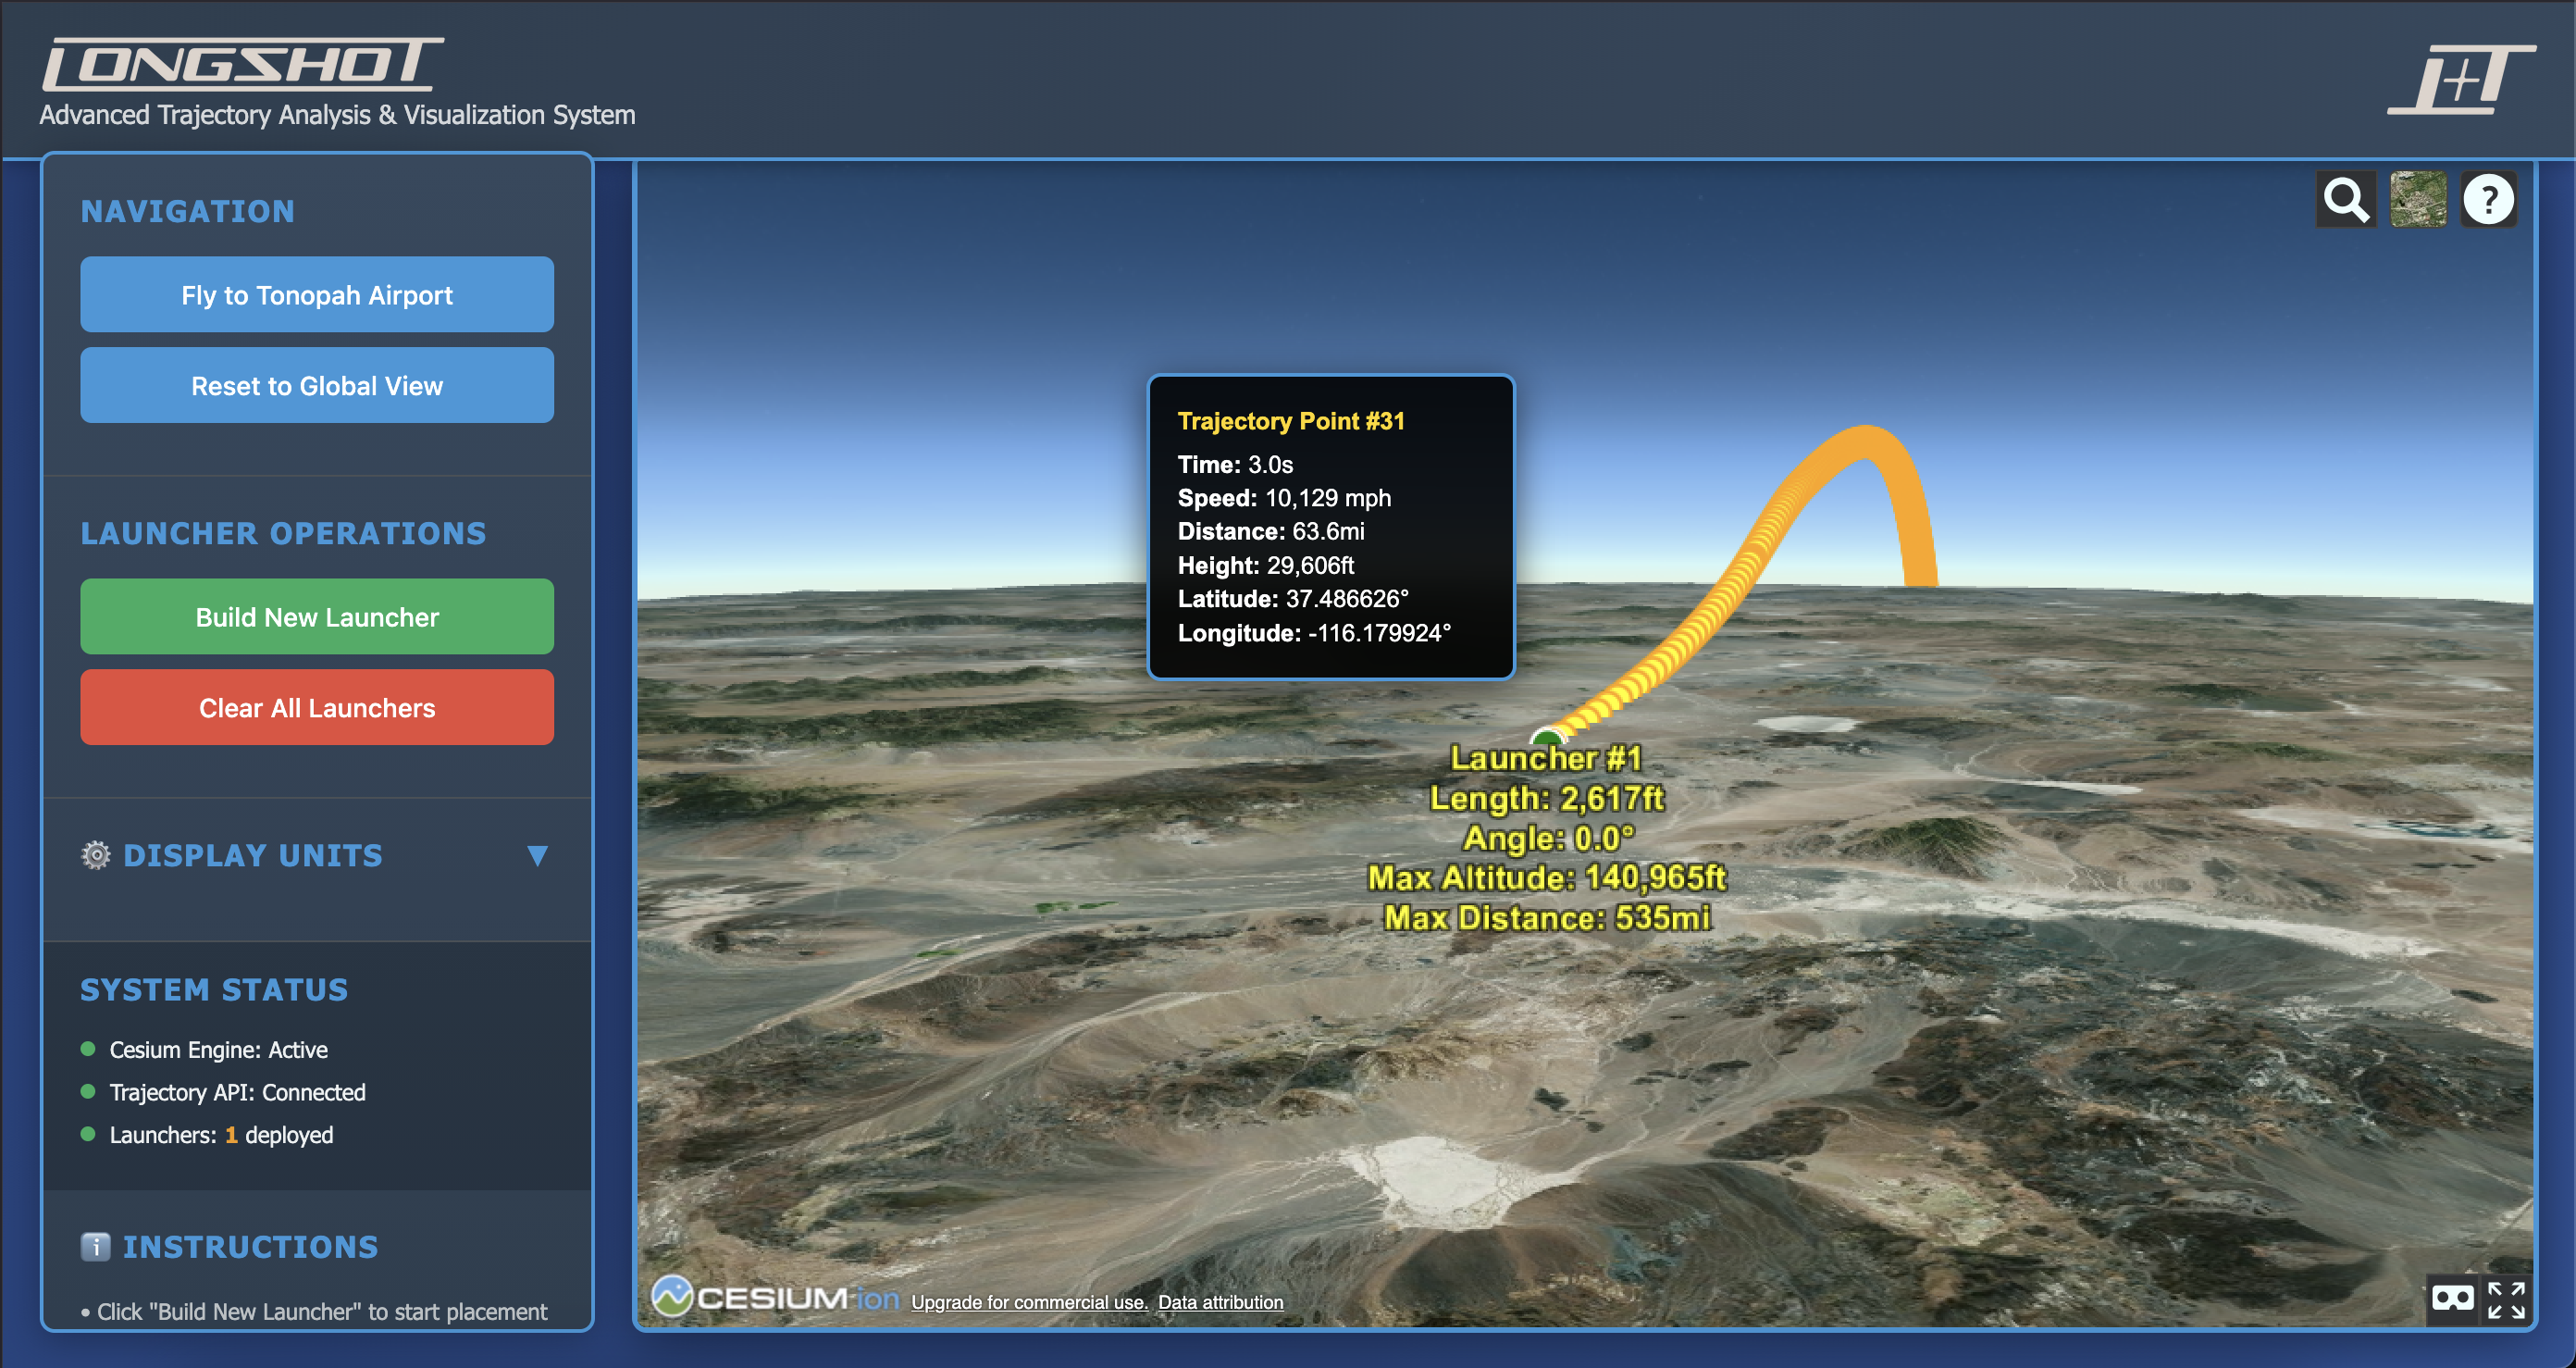
Longshot is building a kinetic launch system — essentially a massive cannon that accelerates payloads to orbital velocities. The physics involved are extreme: projectiles traveling at Mach 4+, trajectories spanning hundreds of miles, altitudes reaching 140,000 feet.
The engineering team was working with spreadsheets and static diagrams. They could calculate trajectories mathematically, but they couldn't see them. When you're designing a cannon that shoots into near-space, intuition matters — and intuition requires visualization.
"We knew the numbers were right, but we couldn't feel whether a trajectory made sense until we could actually see it in context — over real terrain, at real scale."
Real terrain, real physics, real-time feedback
I built the visualizer using Cesium, a 3D geospatial platform that renders actual Earth terrain and satellite imagery. This wasn't about making pretty graphics — it was about grounding abstract calculations in physical reality.
What I Built
- 3D trajectory rendering over real terrain
- Interactive cannon configuration (length, angle, position)
- Real-time physics calculations
- Trajectory point inspection (speed, altitude, coordinates)
- Multi-cannon comparison views
Key Decisions
- Cesium over custom WebGL for terrain accuracy
- Color-coded trajectory segments for velocity
- Click-to-inspect any point on the path
- Shareable URL states for collaboration

From calculation to intuition
The visualizer became a core tool for the engineering team. It's used in planning sessions, investor presentations, and day-to-day design work. More importantly, it changed how people think about the problem — trajectories stopped being spreadsheet rows and became tangible paths through space.
What I learned
This project reinforced something I keep coming back to: the best tools don't just display data — they build intuition. The Cesium terrain wasn't strictly necessary for the calculations, but it was essential for understanding. When engineers could see a trajectory arc over the Nevada desert, they could feel whether it made sense.
It also taught me about working in high-stakes hardware environments. Software iteration is fast; hardware iteration is expensive. The visualization tool helped the team make better decisions before committing to physical tests.